
Our daily TPO profile graphic for 05Feb.
This graph shows the price discovery
lower from the upper micro cluster (97s-98.20s)
into the middle Jan cluster, 97s-95s.
Plotted are Support (blue), Resistance (red),
& Points of Control (green) which
provide insight into levels of significance
based on market structure, not opinion.


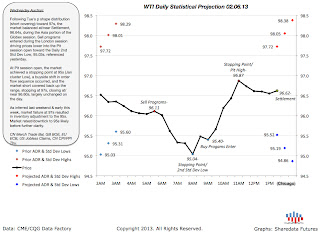
Our daily statistical study plotting both key reference levels & price action for 05Feb and projected levels for 06Feb.
This graphs shows our daily statistical expectations for 06Feb: (95.60, 95.31, 95.03 as potential support levels) as well as the inferential analysis for price discovery toward the 95s.
Result?...
The sellside auction began during the Globex session auctioning lower into the Pit session open toward the Daily 2nd Std Dev Low, 95.03s, referenced on 05Feb. Additionally, the 95 level was clearly identified in the TPO profile graphic as key structural support.
The market achieved a stopping point there before rallying back up the trade cluster, 95s-97s, closing at/near the high of the day.
Knowledge of the structural & statistical significance of the 95s via the TPO profile graphic
and daily projections graphic informed the participant as to the high probability that the market would encounter a buy response there, allowing for the exit of short positions and/or initiating of long positions.
This insight provided the tools for highly efficient
trade based on the market generated data, not opinion.
For additional information & a 5 day free trial,
please visit our subscription page.