
Our daily TPO profile graphic for 01Feb.
This graphic shows the micro cluster/
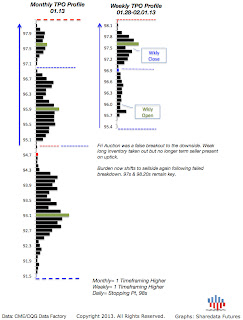
range extension development from 97s-98.20s
above the prior trade cluster (95s-97s).
Plotted are Support (blue), Resistance (red),
& Points of Control (green) which
provide insight into levels of significance
based on market structure, not opinion.
Our daily statistical study plotting both key
reference levels & price action for 01Feb and
projected levels for 04Feb.

Result?...

Following the market reopen
during Sunday Globex session, the market
was sellside into the Pit session open
auctioning down to the Daily
2nd Std Dev Low, 96.07s, referenced on 01Feb.
The market achieved a stopping point there
as buyside shut off the auction.
The market adjusted inventory in a rally before
closing at/near the low of the day.
Knowledge of the structural significance
of the 97s via the TPO profile graphic
coupled with the levels of statistical
significance via the projection graphic
informed the participant about where the
market was likely to travel given the context
of a breakdown.
These insights provide
the tools for highly efficient trade based
on the market generated data, not opinion.
For additional information & a 5 day free trial,
please visit our subscription page.