
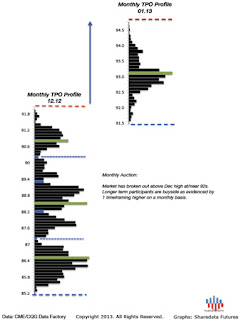
Our weekly TPO profile graphics for 11Jan.
These graphics clearly show the early Jan upside
breakout above the Dec distribution. Here, we
also see the weekly auction higher/range extension
above 93.70s to at/near 94.50s.
Plotted are Support (blue), Resistance (red),
and Points of Control (green) which
indicate monthly & weekly levels of significance
based on market structure.

Our weekly statistical study plotting both key
reference levels & price action for the week ending 11Jan
and projected levels for week ending 18Jan.

Result?...
Following the balance phase early the next week,
the market continued upside price discovery toward
the weekly 1st Std Dev High, 95.72s, achieving
a stopping point & balance there, closing
18Jan at/near 95.42s.
These graphs help provide a holistic view
based on the market generated data, not opinion,
to inform the participant of statistically probable
destinations and the resting supply/demand clusters
of the auction.
More efficient entry & exit.
For additional information & a 1 week trial,
please visit our subscription page.